Chart operations
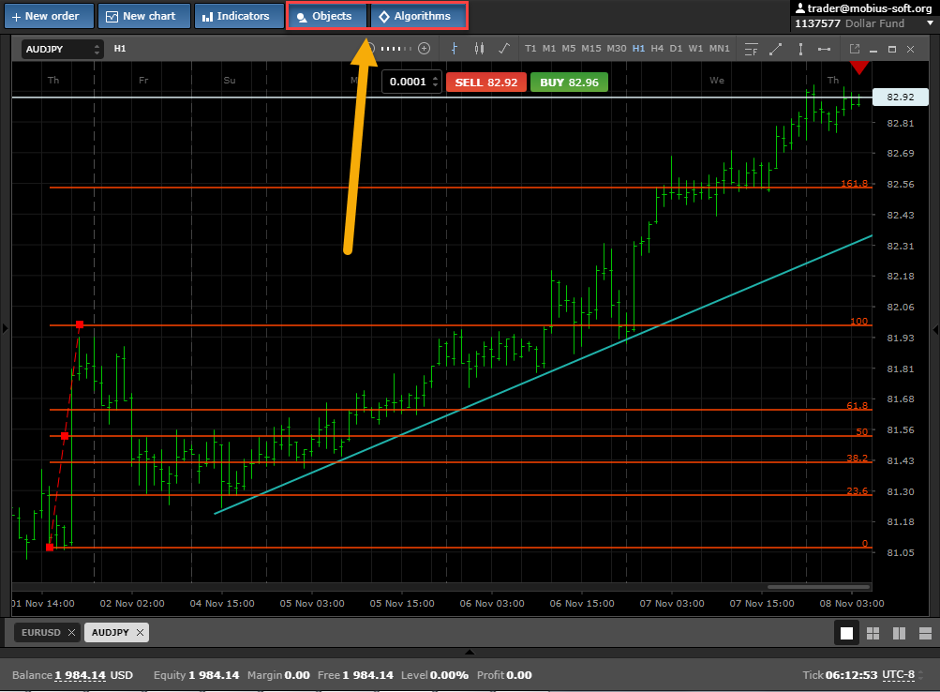
To open a chart in the Dexly pro platform, you need to click the chart open button opposite the selected tool
At the top of the graph is a panel on which you can switch the time period (time frame)

change the graph view:
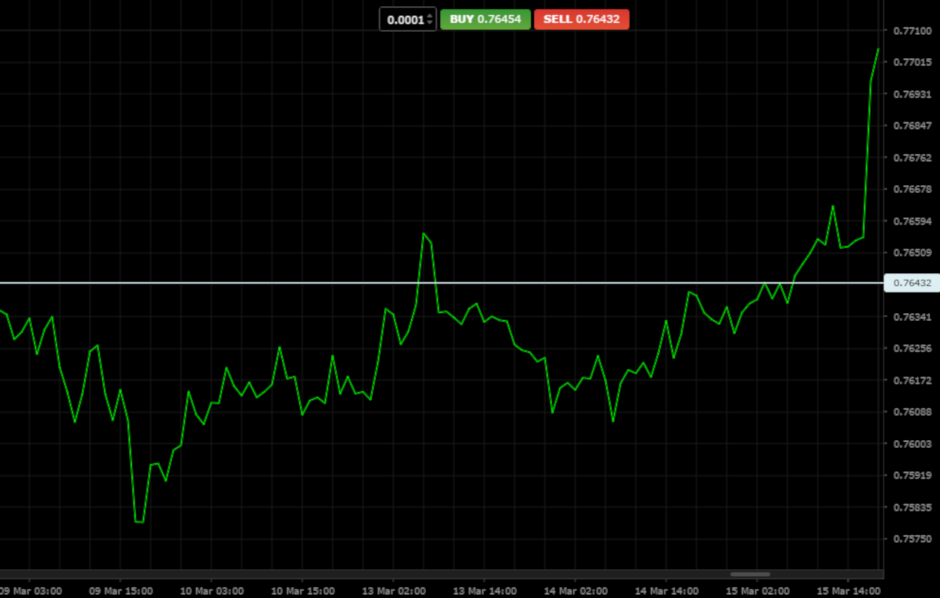
1) bar chart
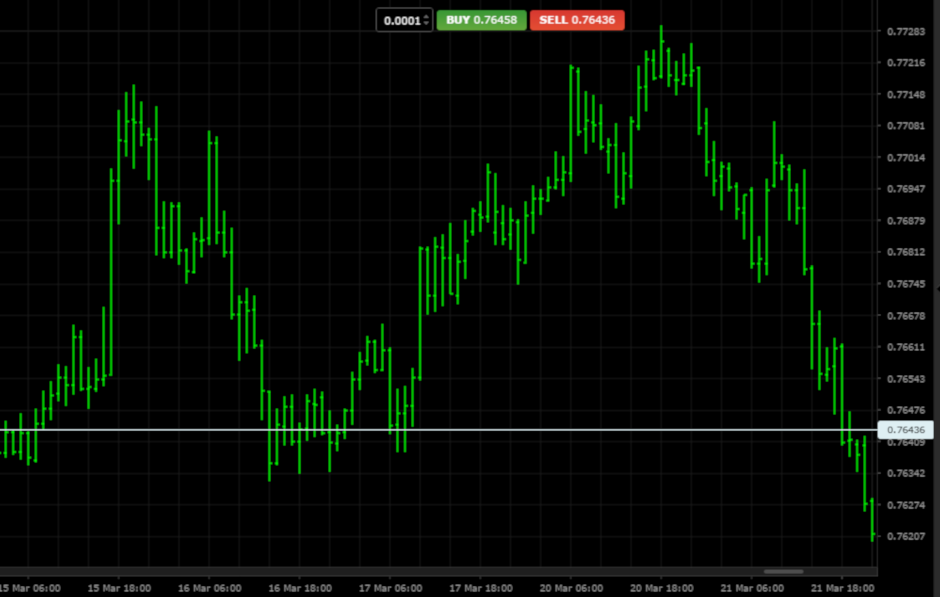
2) In the form of candles
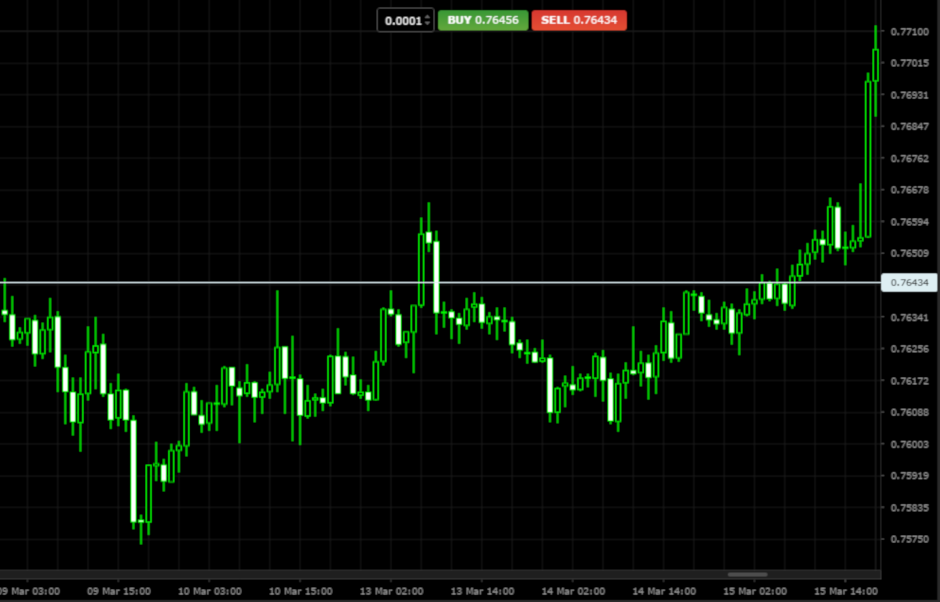
3) In the form of a line
Also in this panel you can change the scale of the graph from the smallest size
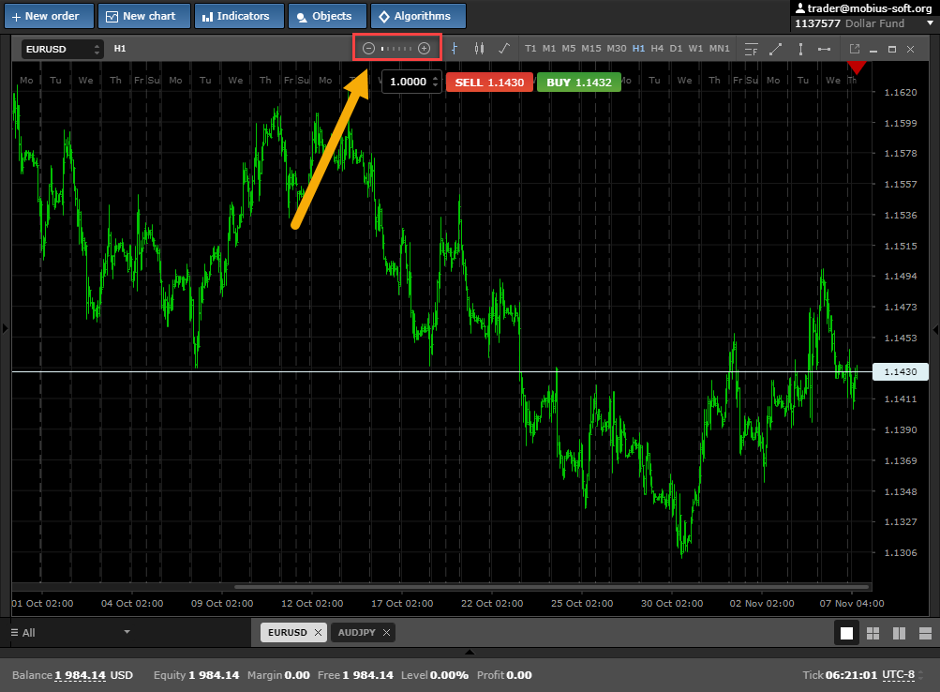
to the maximum
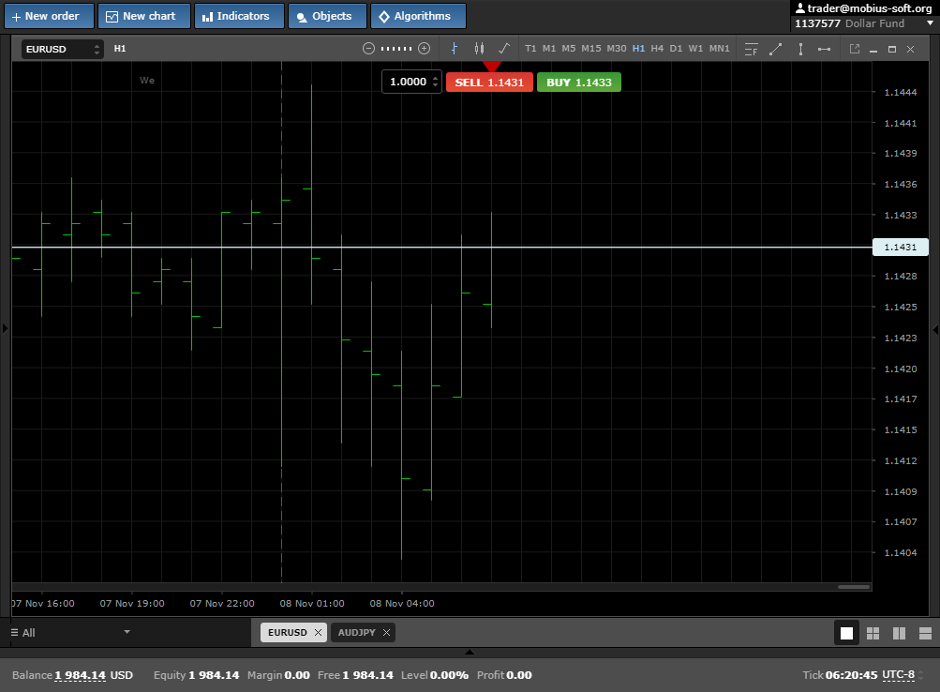
Chart Dashboard
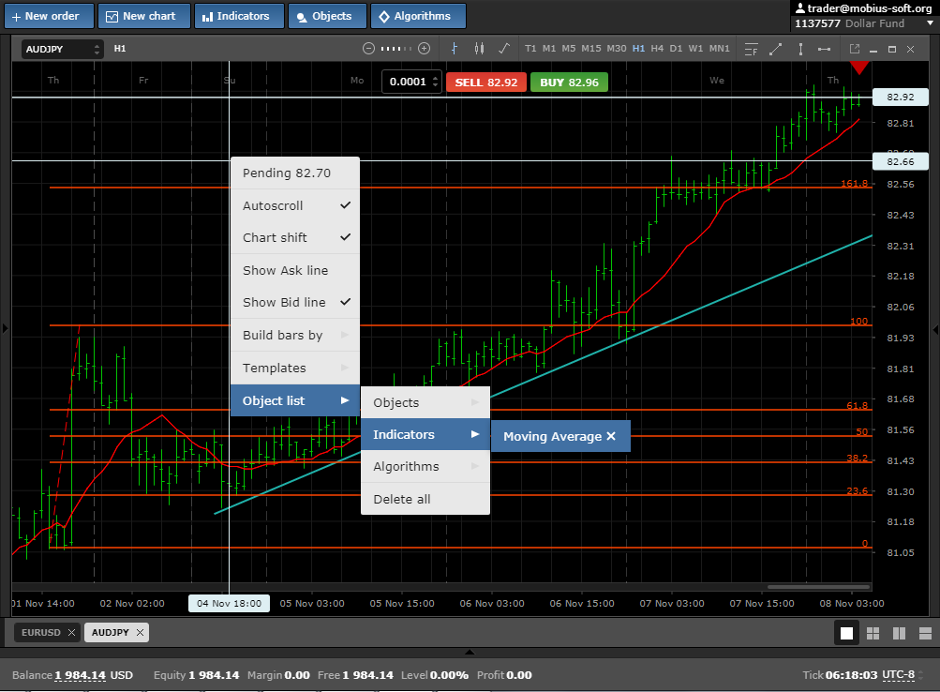
To open the window of additional properties, right-click on the graph anywhere. You should have such a window
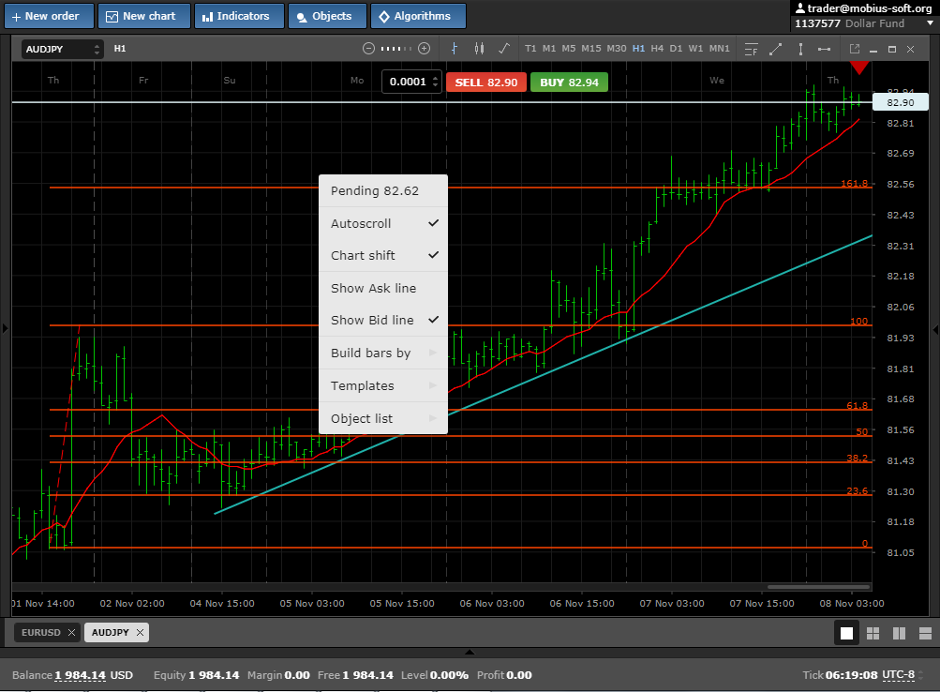
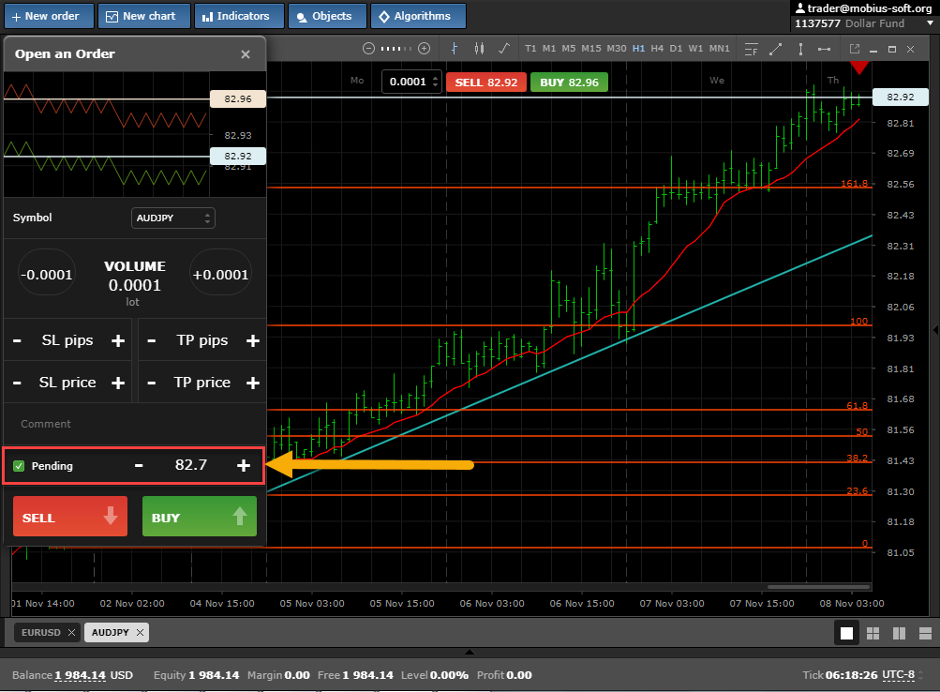
In this window, you can configure auto-scrolling and chart offset, as well as check the placement of the Bid and Ask price lines. When you click on the “Pending” tab, the “New Order” window will open with a check mark on the pending order.
Also in this window you can manage all the objects and indicators that are on the chart. You can call the properties of the object or delete.
You can superimpose indicators on the chart from the tab at the top of the Indicators terminal and graphical objects from the Elements tab